ABOUT

Hello, I'm Smada and I really enjoy playing fantasy baseball and building data tools. I have a real job, but for fun I am a site partner at ProspectsLive.com and a contributor at Friends with Fantasy Benefits providing support for The Great Fantasy Baseball Invitational. At Prospects Live, I manage Minor Graphs and the Interactive Prospect Lists as well as provide data support to the writers and podcasters. All my projects are listed below. If you have any questions, the best ways to reach me are on twitter or through email (both above).
PROJECTS
Minor Graphs
R -- shiny server -- github -- scrape -- dplyr -- ggplot2 -- ggiraph -- gghighlight -- ggridges -- baseballr -- MiLB -- fantasy
- Select a MiLB or MLB player and view interactive rolling trend graphs, metric distributions and spray charts for their entire MiLB & MLB career.
- MiLB game log data scraped from Fangraphs through an edit of functions in Bill Petti's baseballr package, presented in an R Shiny app. These MiLB scrape fuctions were contributed to the baseballr package in early 2019.
- Now hosted at ProspectsLive.com
- Follow @MinorGraphs on Twitter
- See the code on Github
Interactive Prospect Lists
R -- shiny server -- github -- dplyr -- DT package -- MiLB -- fantasy
- Select from a list of prospect lists created by the Prospects Live team. Filter the lists by team, position, age, ETA and more. Download the data and see the individual ranker breakdown (if applicable).
- See the code on Github
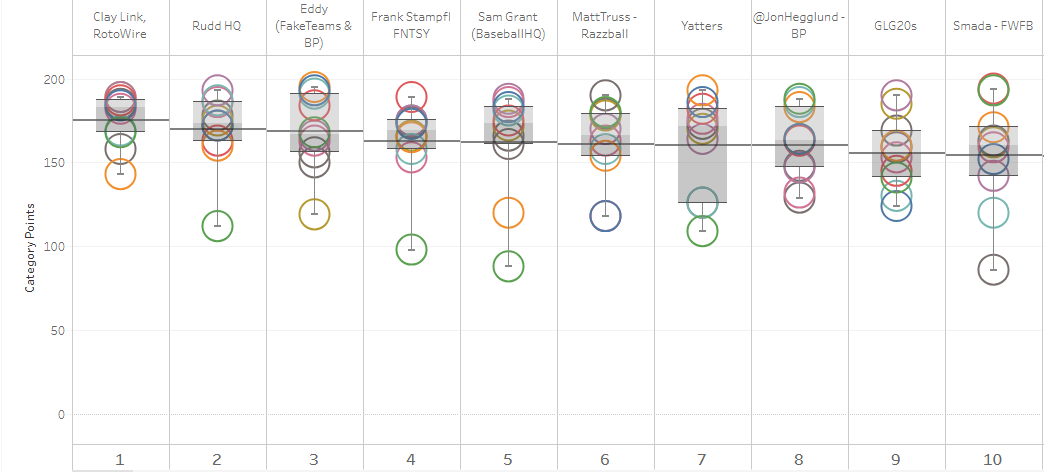
The Great Fantasy Baseball Invitational (TGFBI) Standings & Overview (2018)
Tableau -- Google Sheets -- importhtml -- query -- vlookup -- sumifs -- fantasy
- View overall standings, FAAB info for players & teams, team info, player insight & more for the inaugural season of The Great Fantasy Baseball Invitation, also known as TGFBI. Follow along on Twitter @TGFBI and through the hashtag #TGFBI
- Automatically updated throughout the day by scraping TGFBI standings data from Fantrax into Google Sheets, then uploaded to Tableau.

TGFBI ADP & Projections 2019
Google Sheets -- vlookup -- sumifs -- fantasy
- For the 2nd straight year, I ran a Google Sheets doc for live ADP and team projections during the 21 simultaneous TGFBI drafts.
- ADP was live updated by the team at Fantasy Benefits. Team projections were then calculated using Fangraphs Depth Charts projections.
2019 #2EarlyMocks ADP
Google Sheets -- importhtml -- vlookup -- sumifs -- fantasy
- Run by Justin Mason of Friends with Fantasy Benefits, the #2EarlyMocks were the earliest collection of mock drafts for the 2019 season. ADP was live-updated across 9 leagues through Google Sheets.
- View ADP, adjusted for auto picks and incomplete drafts, along w/ pick variance and which manager took each player the highest.
Bunt Rank
R -- shiny server -- social user interaction -- Topps Bunt
- Bunt Rank's goal was to create user generated rankings for all cards in the Topps Bunt app (a mobile app for collecting digital baseball cards). In conjunction with the rankings, Bunt Rank aimed to be a community hub for Topps Bunt users.
- Bunt Rank was my first large project with Shiny and started with a simple app for calculating the probability of pulling cards from a given pack (under Tools dropdown). The value ranking score are Elo rankings calculated from the aggregation of user selections.
- Tabs include:
- Homepage where I created a non-secure login feature and tracked user rankings.
- Rank Cards menu where the user could rank either the value or design of the digital cards
- View Rankings menu for card value, player rankings and design.
- Compare cards tab where you can see two cards and their data side by side, along with comparable ranked cards.
- Discuss tab that acted as a chat room (edited from an existing tool on Github).
- Tool menu that held the pack odds calculator.
- More menu that held the about section, an FAQ, and a placeholder for future settings.

